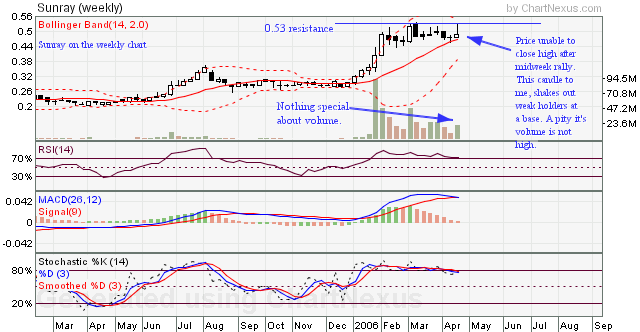
I caught some questions in my shoutbox and would like to clarify. Elizlow was asking why did i say chart nice on thursday and then say not nice on Friday? When i was talking about thursday is refering to the weekly chart of sunray. At 0.520, it looks like a breakout of 0.540 was coming. But we all know it didn't happen, and in the end it closes at 0.490 on Friday inline with my warning. The warning serve for Friday only because i could see reversal on the cards hence serves only as warning. You can imagine how those people who bought at 0.520 is feeling now.
I have included a whole list of charts and our favourite blueline theory below. I will be busy over the next 3 days so you won't see me in the shoutbox. Even though i'm not around, if my blog has helped you grow money or learn some technical analysis, i hope you can return me the favour hor. If really no ones supports, my blog will go bust! :D A great way to pay "subscription" ma...no need to come out from your pocket leh!


GrowMoney Quickpick
Stock: Line of least Resistance
DBS: 17.40
SembMarine: 3.2
Stats: 1.33
TechOil: 0.835 (Trading Halt, positive news, may gap up)
CAO: Support at 1.28..great catch if can get.
AddvHoldings: support at 1.42
DISCLAIMER: This is not an inducement to buy or sell. You should do your own analysis on top of my postings. Copyright © 2006 GrowMoney Blog. All rights reserved.