Many traders have been eyeing to do a quickie tomorrow based on technical rebound anticipation. Normally after a very bad day, there will always be "investors" to buy their favourite stock at cheaper prices. So if you are savvy enough, you can try. I too noticed some hammers formed on some bluechips' charts like Cosco Corp, Capital land & Keppel Land.
Hammer is a bullish signal that needs confirmation with a white candle in the next trading session. Volume is key here. The psychology here is, the counter was sold down by bearish traders to a low in the intra day, however the price could not close at the low. It is being buy up by bullish traders. Thus forming a hammer.
There are many ways to trade the market. As conversed in the chat window above, we can trade breakouts, we can fish bottom or we can trade trading ranges. Choose your most comfortable strategy and make sure you have discipline cut loss. I can't emphasis enough how important this is. Many people has been hurt by ill discipline in trading. Take care of your losses and your profit will take care of themselves - Alexander Elder
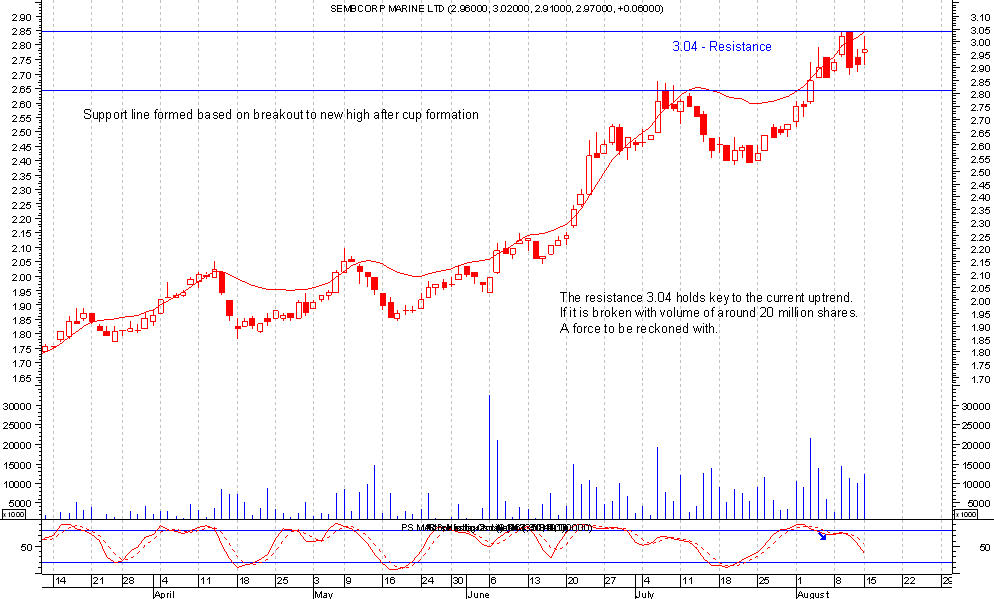
Semb Marine: Threatening to break all time high again.
STI chart. Together with some bluechips, it has rebounded of support line.
The support at 0.510 was tested today and the price rebounded to close at 0.515. It must be noted that the share price has been hitting lower highs with a steady volume averaging 1.6 million shares during the last 3 sessions.
Volume bearish divergence has also been spotted where the latest new high has a volume lower than the previous rally as denoted by the red arrows in the chart - Chart Software courtesy from Chartnexus.com