You may want to consider one of the ChartNexus Events, Get the Basics Right conducted by industry expert. This is a comprehensive one full day course which will enrich you with the basics of technical analysis to read stock charts like a professional. You will also expect to learn how to read market directions, rotational plays and a profitable strategy.
Last week's near capacity strategy class was really an enjoyable session! In a room of passionate like minded traders, I felt so satisfied being able to explain my thoughts and ideas on the market, not to mention being totally exhausted by the flood of questions! haha A simple strategy using Candlesticks Reversal Pattern and Stochastics was shared. I hope you guys will find it useful. Not forgetting the simple warrants selection criterias explained, this should help to stop bleeding from trading the wrong warrants. Huat Arh!
In my 2.5-hour course, participants will be taught on how to understand, identify and use Candlestick Reversal Patterns with Stochastic signals to time their trades. For short-term trading, the methodology of proper warrant selection will be explained. As for my last class for the month, we still have seats. You may want to register and join us for the 12th Sept 2006 session.
HSI: Bearish piercing pattern found on the weekly chart with bearish divergence in MacD Histogram. This doesn't mean we will head into bear market. The reversal could just be short term. Nobody knows for sure. We will let market tell us.
Otherwise, there is immediate short term upside base on daily chart. There is a gap resistance to fill though.
Nikkei: Possible Hanging man reversal in the making on the weekly chart because we need the upcoming week to be down to form a confirmation. A bullish piercing on the daily chart formed last Friday for a short term upside. But should the bullishness continues, then there will be no more bearish confirmation on the weekly, good news!
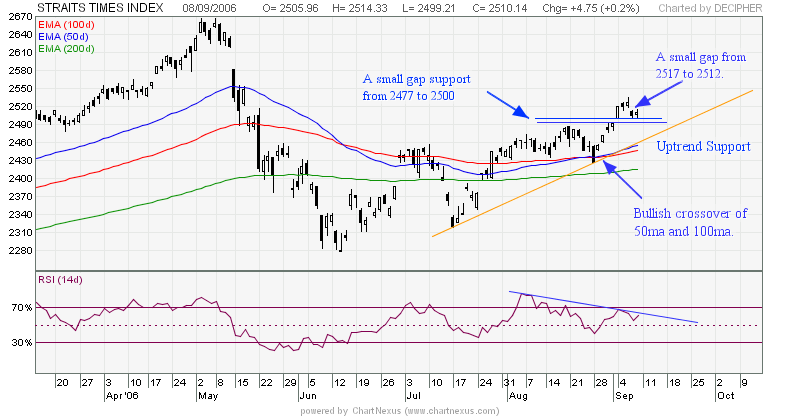
STI on the daily. Take note of the huge space we can afford to retrace yet keep the uptrend intact.

STI chart on the weekly.
I mentioned about a possible reversal in Fungchoi and had monitored it's closing on Friday. The reversal formation did not happen afterall and I won't look at fungchoi as yet. I rather buy when it shows that it's reversing. Nevermind if I lose a few bids, as i know this few bids is my insurance against a false reversal.
DISCLAIMER: This is not an inducement to buy or sell. You should do your own analysis on top of my postings. Copyright © 2006 GrowMoney Blog. All rights reserved.