After reviewing the breakout plays on Sunday, I realise that a breakout in volume doesn't guarantee a breakout in price. The failure rate is pretty high. Chart formations plays a part. They reflect the normal buying, profit taking, buying sentiment of the counter. Historically if a stock is in a healthy incline, after a surge, it will form the bottom of a cup and handle as there are some profit taking by sellers but! there are also buyers who are looking to consolidate more shares. The it test the left side of the cup again, following that is another decline in stock but on very light volume. This is the kind of chart pattern accompanying a breakout in volume most profitable. Do you have the patience to wait for it to happen?
Other formations include double bottom and tight range breakout.
Also, I have been shouting breakouts upon volume confirmation. From now on, future breakouts in volume will be strictly screened and only valid breakouts with chart formations will be presented at 4:30pm daily.
As for market directions, strong economic data pushed index higher but the volume ain't convincing. However individual stocks like SPH has recorded higher than average volume. If more counters follow this trend, the bulls are back. Watch volume for indication. Also, Hewlett Packard is expected to deliver a strong set of FY05 results by market. If that happens, it could be the catalyst for a rally tomorrow in tech related stocks.

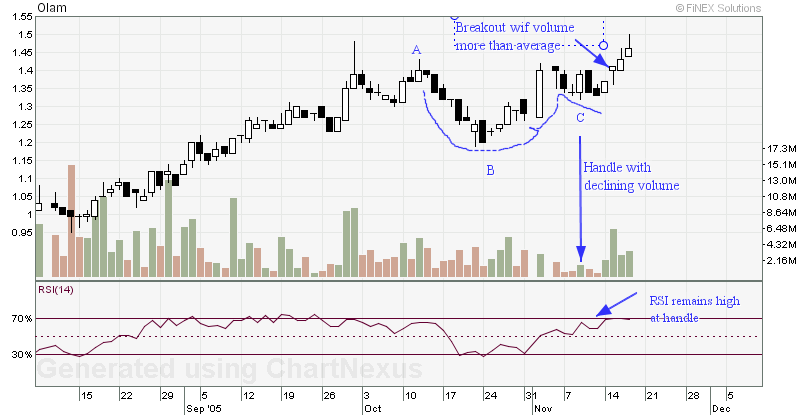
Olam - Check out it's similarities with DataCraft posted yesterday. I wouldn't advocate buying now. I'm just highlighting the importance of a handle for cup and handle breakouts.