Thursday, December 08, 2005

Stock Market Directionless (Starhub, Metro, Rotary)

STI closes marginally positive on yet another lacklustre trading volume. We are pretty much directionless for now. After completing my daily sentiment scan, I saw mixed sentiment. There are volume in both decline and incline. The sector I noticed was oil & offshore related. One of them broke out of it's 50 days volume average, Rotary. The other sector is telecommunications. M1 and starhub appeared in my list. But comparing M1 and starhub, I prefer the latter as it has chart formation and good volume characteristics. We are left with 2 days of trading for this week. I will not like it if STI closes at resistance or worse if it close down the resistance line. If it's really a bullish tone, we should see STI clears 2353 there abouts.


Starhub - sudden increase in volume and activities


Rotary breakouts - oil and offshore play


Metro - Why i missed it.

Tuesday, December 06, 2005

Stock Market Stunned by a little bee

Let me start the day with an introduction to yet another new service! GrowMoney Insurance !
No one plans to fail, but many fails to plan. Through this site I hope to discuss insurance products or issues as I found many of my friends either don't know what policies they hold or understand too little of their rights. It is so unfair to blame insurance when in the first place people buy blindly (me included). haha! Ok let's continue to the market sentiment.

STI sank by about 1% on a volume greater than the 14 day average. Doesn't sound too positive to me. Further analysis through the 758 stocks showed that all is not lost yet as most of the bluechips remained unhurt. There were more volume in going up than down. Hence I remain cautiously confident of a higher high in our stock market.

Looking at the STI chart plotted on Sunday, we had hit the resistance line and fall back. I see support at 2298 there about. If we are able to touch and rebound off there, it will record a third higher low and we can be on our way to a third higher high. A sign of up trend. I remember many analysts calling for a correction before the Christmas rally. Well, this is it, in the next few days we will know. If you had followed my journal, it is interesting to see how i was unable to find a good risk/reward stocks to invest in since Sunday. Coincidence? ; )

No charts tonight as the general direction is unclear. To me, it is more risk than reward to get invested at this stage. I did saw Metro Holdings and Labroy Marine broke out of 50 days average volume. But since there were no visible chart patterns, i prefer to opt out.

Good luck to all the brave hearted! : )

Monday, December 05, 2005

Stock Market Lessons learnt on MMI & Meiban


Sorry, webhost blogspot went down during the morning. Free hosting service la, so bo pian. :) hehe

Stock market Daily scans yielded nothing fantastic. There were no good risk/reward stocks to highlight to everyone. It's a rather mixed market day, slightly more to the upside. Bluechips were mainly quiet. Small caps getting more attention. We saw how there were selling during the intra day and we close up with late buying. Late buying is always good, it's a show of bullish sentiment. However the volume is too thin to judge, so it can still swing anyway. Let's see how the rest of the week develops.

Today, i'm going to talk about 2 mei meis....MMI and Meiban. Why you should sell Meiban and buy MMI.


MMI - I was fully invested in other stocks and had to give this runaway baby a miss. No wonder they say the rich gets richer. Maybe I should have sold my stocks struggling at resistance. Did I fall in love with my stocks just because it's given me a 20% paper profit? I must flush this relationship out of my system!! Am not going to miss another MMI.


Meiban - the shooting star

Sunday, December 04, 2005

Interesting week ahead

Surprise suprise! After going through my scans, I could not find any good risk/reward trade. I think it is the time now for those vested early to reap in the rewards. Unfortunately, it is also the time where the uninformed average investor buys at a poorer risk/reward factor. It is a known fact that only 10% of investors are winners, 90% are losers. Some of the most obvious counters that ran away were from the technology sector where time and again I have noticed the light trading volume and low price volatility. For those with 100% cash, fear not! I have also notice some counters undergoing normal corrections. One of them is HuanHsin. When it's time to look at them, you will hear it first from growmoney blog!

After studying the charts posted in the November Archives, I found the following important clues regarding breakouts.

1) There are heavy volume on up days than down days.
2) There should be a shake out on heavy volume near the bottom of the chart formation.
3) Low price volatility on low volume is the key to successful breakout.

I'm sure there are more, but the above are the most common clues. The most important thing is, these are exactly what William J. O'Neil wrote in his book. It happened in the US market, it happened over the last 50 years and it happened in our market in this time! If you want to own this book, you can find it at the local bookstore or at my new site growmoneyshop.blogspot.com . At this site, i recommend books that I found most useful in my trading education.


Straits Times Index - crucial time for the bluechips.


Huan Hsin

Friday, December 02, 2005

Unexpected happened? No way, the clues were there

With overnight US trade retraced badly, alot of pessimism crept up in local market again. However a strong performance from Hang Seng & Nikkei proves too much for our local traders to ignore. We close up with late buying! Late buying is very important. If you had followed my journal so far, you would have noticed late buying often leads to higher highs. As for the sector to focus on, Tech sector, I think i have been highlighting for the last 2 weeks. I saw light trading volume upon correction after a breakout. The whole sector was behaving like this. Hence it gives me great confidence in this sector.

The time now is 1:25am and Dow jones is at 97 points, Nasdaq 28 points! This should encourage buying tomorrow morning. As it is a Friday, late afternoon profit taking can happen.

There are no breakout counters today. Mostly are continuation of the uptrend after the corrections. I will only showcase good risk/reward counters in my blog. Daily sentiment scan showed that it was a mixed market. However, plastic and Tech stocks had the most volume hence remain the likely stocks with more upside. I personally did not like plastic due to it's sensitiveness to Oil price. However it's current run proves that, opinions are often wrong. If I had stuck to the technicals, I will be a few percentage richer! :D

This weekend, I will be checking out on the breakout rally counters and spot any similarities. Be sure to tune in!

Thursday, December 01, 2005

Tech stocks leads in rally (Singapore Stock Exchange)

We started with a bang and ended with a fart. Yes, that's how the STI daily chart looks like now with a big black candle with breakout volume today. Incase you didn't realise, we are quite similar to how US ended previously. However, upon completion of my daily sentiment scan of the market, more buying than selling. Most noticeable is tech sector. I was correct in anticipating that it will lead the next rally. It really feels good to know my thoughts and analysis is insync with the market. This should enable me to make informed decision.

Even I was tempted into selling my DBS babies today. After considering for a few minutes, basic trading rules reminded me that I should sell. My reasons were, DBS had tried a time too many to break $16.50. Also the babies I bought expires in Feb'06, the time decay effect will kick in. I am tempted to wait for 0.30 to sell but I tell myself this is babies and not a share. The time decay will corrode the price. So in the end, I decide a profit is a profit. Only fools wait to sell right at the top because no one can do that!

I noticed many of my friends had a similar problem. They are only concerned with "Have you make money overall?" My answer to them is honest and simple. "No" Then they will think they are speaking to a fool who losses money in the market. But what they did not know is the amount of hardwork I put in to research why I had lost. Infact, the bleeding stopped this year and I have been winning consistently in recent months. It is not how much you lost in the past that decides your future. Rather, it is how much you are going to make! Be forward looking, why bother to look bad and judge? They will not understand the whole trading psychology and hence I stop short at that. So one day, I hope when they hear about my growmoney blog from their friends, they will realise I am no fool in trading. Meanwhile, I will continue to be a student of the market.

No breakout counters today because they are way above my buying levels. If you scroll down or read the November Archives, you will notice most of them rally today. This is the importance of my trading system, chart formations + volume breakout == high chance of profits!

If you don't already know, I have 2 more sites to help the trading community.
freecharts.blogspot.com
begintrading.blogspot.com

Tuesday, November 29, 2005

Late buying in stock market ( Media Ring )

For the umpteen times, another light volume day. A fellow trader reminded me that it is the roll over date of Simsci futures and hence the stocks can move unusually. He added that, today's actions shouldn't be taken too seriously. US stock market corrected slightly on the Dow but about 1% on nasdaq. On any other day, tech stocks will be greatly hit by such a performance by nasdaq but they were resilient today. I continue to fancy this sector as the trading volume is light and price range very tight. When it breaks out, so will STI! Hey wait! how about banking and property counters? They have been largely forgotten. *wink*

The last time late buying was seen, Nov 22nd (scroll down), it was a superb rally next day. Will history repeats itself? The late buying can only occur because smart money knew what will and is going to happen.

Breakout wise, Plastic stocks continue to register gains on heavier volume more than 50 days average! Fu-yu, Meiban, Huan Hsin & Fischer Tech appeared on my list. I shall continue to snub it. : ) As the wise man always say, price doesn't travel 1 straight line up. I shall wait for corrections and judge it by the volume. Crude oil futures continue to slide, this helps the plastic stocks. I prefer MediaRing to chart, it should extend it's gains today from here.

If you don't already know, I have 2 more sites to keep your trading hours fun!

freecharts.blogspot.com
begintrading.blogspot.com


Media Ring - The time is ripe!

Monday, November 28, 2005

Singapore Stock Exchange Awaits Directions from US (BeautyChina)

Even a superb trade results of Singapore Manufacturers data could not stimulate a convincing move. Most of the talk in town is of a correction to STI before the move up north. This could have lead to the lacklustre volume as traders/investors alike prefered to stay sideline. Another factor could be the US market. We are waiting for brother Wall Street for directions. Nikkei had rallied 200 points and yet our market is looking west. The finish today on the market is not very comforting. No doubt it had stayed above support 2280, but the light volume is a concern. It can swing anyway now. I am taking cue from the US since I smell the market relying on it.

On my Daily sentiment scan, same as days before. No clear directions yet. Although I see some counters breakout in good volume but the price movement is small. This could be a shakeout, distribution. Breakout wise, of the many charts that I went through, I like BeautyChina best. You can see the chart below. As for the rest, I prefer to err on the safe side. These include plastic stocks. I will wait for the higher low, higher high or chart formation to time my entry. For all we know, it could be a bull trap.

I have also started 2 more websites as Services provided by GrowMoney Blog. For the first, a Beginner's guide to trading. I will share my knowledge accumulated all these years to newbies who want to trade/invest but don't know where to start. I have received lots of help. Now that i'm comfortable with how much I know, I want to share. Second website is for chart requests. During quiet market time, I simply cannot find a breakout charts. Hence I can make use of my free time to help fellow traders who want a second opinion on stocks they are eyeing.


BeautyChina: this one has financial instituitional support

Sunday, November 27, 2005

What's next after a quiet week in the Stock Market?

Due to the increasing support of my blog, I am promoting a new service for my readers, "chart requests". : ) You can email me your chart requests and I will give my best analysis on the top requested chart on my site daily if time permits. Please note that I will only analyse liquid stocks. Rational is simple, Technical Analysis works best with liquid (High Volume) stocks. Well, this is my safeguard against manipulated movement.

As for breakout shouts at 4:30pm. After 2 weeks of trial, I realise studying and scanning the end of day data will spring up better opportunities rather than jumping to buy before market closes. However if there is really a very good breakout, i will still shout before market close so no harm logging to my site from 4:30 pm to 5pm. Infact, some readers have posted very good breakout shouts at my ideas corner. : ) Thanks guys!

Doing my sentiment scan on the weekly charts, nothing bearish was spotted. There were no major selling in the market. Infact during the thanksgiving holidays, we had very light trading volume. I especially like the light volume on Friday and selling. It means people are taking profits. This group of people will in turn be buying back the shares at a later time, thus the uptrend can and will be sustainable. Majority of the counters traded with volume less than their weekly average. No clear directions yet but let's not get complacent. Keep looking out on the slightest hint of buying or selling by the big boys. Where can you find this info? Of course you will hear it first from Growmoney blog!

If you find my site useful and can relate to your psychology in trading, do recommend to your friends. I intend to build a very large reader base and then move to my own website. Information will still be kept free and donations flowing to charity! : D


A look at Dow Jones. No charts tonight as I prefer not to base my analysis on light volume trading.

Thursday, November 24, 2005

STI more upside

I found 2 more breakouts to add to the one shouted at 4:30pm. Sorry I had to discount Wingtai because the chart formation and indicators doesn't look attractive to me after close examination. After my daily sentiment scan where i decipher the market by volume and price actions, I discover most bluechips are still sleeping. Volume are not even close to daily average. In addition, the selling today is pretty well absorbed. Weak holders could have tempted to take some profits first as there is still uncertainty in the air. I especially like the technology sector. After the recent rally, most of them retraced on feather light volume.
With STI now resting at 2306, I think my target of 2350 is achievable when technology sector and banking sector rally again.

For those unaware, Cosco stock split 2 for 1! MapleTree bought more properties (this explains why it's volume was so heavy yesterday). Semb Kim, I mentioned lots of insider buying and it was a breakout as reported yesterday. Guess what? This morning it released a piece of positive news... now we know why the heavy volume yesterday. Is it fair to us the retail investors?

I would like to re illiterate that breakouts are not for contra. It can retrace up to 8 sessions before another push up. Also it is not a holy grail. Infact there is non in this world. No system is perfect. So please have your own cut loss discipline in place. If you review past charts, you will notice how breakouts will continue to rock their way past resistance after retracement.


UTAC - breakout in 50 days average volume


Raffles Medical - Flat base breakout.


Aqua Terra - breakout of 14 days volume

Breakouts!

Raffles Medical

Wingtai

Charts Galore!

Time is 1:37am now...i'm still not asleep yet. There are simple too many charts for me to post! :D Decided on the best 8. 8 means huat ma! keke Oh before I forget, I was out for lunch today, and as i stepped out of the car, a flower (those from the trees small small yellow colour one) floated right into my shirt's pocket! :D I thought it was good omen. And needless to say, we all saw how market rally in the afternoon! hahaha

On a more serious note, the market is behaving exactly what I had anticipated. Please read from Sunday's article right though to today inorder to understand what I meant. There are still lots of people not sucked into this bullish run yet. They are still non believers and hoping for retracement and corrections. This is good. Because one by one, they will be tempted by their greed and start to get vested. Not to forget those people who sell into strength. That will be how our STI will move 1 step down, 3 steps up. With the FOMC deciding to stop hiking the interest rate, stocks flew high today. As I am typing this last sentence, US market is rallying due to oil drop. Many people shouted for US market to correct. But time and again it defies. Trading is not so straight forward. Expect the unexpected! Just make sure you sell or buy when what you anticipated happened!


SembKim - Lots of insider buying!


MapleTree - Classic Morning Star!


Huan Hsin - Bullish divergence


Ho Bee - for the bad times and good times.


HL Asia - Another round of rally?


DBS - $17 dream or reality?


Cosco - resume of uptrend?


Chartered SemiCon - A try at $1.40?

Wednesday, November 23, 2005

Tuesday, November 22, 2005

Selling in the day, Late buying Seen

Everyone got a rude shock when market opened today...it was widely believed that US had rallied overnight and we should have our own version. How wrong we were! Market begin to show weakness right from the start and even I was worried. What did I do? I choose not to look at the actions. Yes! This is one way to stop fear manifest in me. Psychology in trading is very important. Find ways to contain your fear and greed! At closing, we saw late buying and index pushed to close -4 versus a heavy -13 experienced intra day. This is very healthy for the uptrend. My best rosy picture is selling for the early part of the week and close up strongly by the end of the week.

No breakout gems today. I saw some counters like Hyflux, Cosco, MFS, KS Energy, bio-sensor breakout in 50 days average volume. However they do not have a convincing chart formation to compliment with. Please refer to the following formula.

Chart formation + Volume Breakout == Higher probability of massive profit

Chart formation is very important in breakout. As mentioned before, it identifies the natural consolidation, corrections and distributions stages of the stock. Hence i'm more wary of false breakout without chart formations.

Currently i'm also trying to learn bottom fishing....will share with you guys when i got it figured out. Meanwhile please continue to support my blog. Thanks! :D Huat ah!
Thanks all those who supported my blog and charity yesterday. : ) Please keep it coming!

Monday, November 21, 2005

Damage is light

I did a post mortem on the stocks and found that the damage today is pretty light. One thing for sure, the volume is pretty light, below the 14 days average mostly. Property and Marine counters doesn't seem to enjoy the volume they once command anymore. Banking and Technology sector generate the most volume so far. REITs continue to be affected negatively by the higher interest rates. I continue to like the way our market is moving. If you are scared right now, snap out of it. Because market will suddenly move up like last Friday. Do not miss the chance. I will turn on cautious mode only if STI test 2190. For now, i see high volume on up days and light volume on down days....what does this tell you?

No breakouts were found today.

People! I welcome any questions on technical analysis or market sentiment. You may post the question in the shout box or email me privately. I will try my best to answer best to my knowledge.

Sunday, November 20, 2005

High can go higher

As demonstrated by DataCraft, high can go higher. People who dare not buy DataCraft when it breakouts out on the first day will no doubt feel like Roberto Baggio in 1994 World Cup finals when he ballooned the spot kick that gave Brazil the title! Who can blame them? It's human mentality to buy at a cheaper price hence most are put off by the "high" price. Even I am guilty of this. What happens next is DataCraft goes higher. A classic breakout as what I had charted last week. Most breakout may fail. However if you take care of your losses (cut loss), the few correct breakouts will more than cover it for you.

As for STI, we finally broke 2293 on a volume of more than average of 10 days. This augers will for it's strength. The most important thing I saw on the daily chart is we had register a higher low. Something that I had anticipated 3 weeks ago. Back then, STI had plunged more than 60 points in a day. The next few session saw an immediate technical rebound and many bought again only to see it gives up all the gains again. That is when I realise I must wait for the chart formation which symbolise the natural consolidation and distribution actions. Now that the higher low is formed, let us see a higher high set by breaking 2350. If it doesn't, I will be careful. Trading is all about risk/reward, i will just make sure my decision is well informed.

Some of you had emailed me about my breakout system. Here I wish to clarify, I did not invent this. This system is cheaply available on the book shelf titled "How to make money in Stocks by William J. O'Neil". I am just modelling he's success. : ) However you may want to know I did not base on just 1 book blindly. I have also understood Japanses candlesticks, MacD Histogram, Stochastics, RSI...etc...along with moving averages. You should click on my picture on the left panel to see what other books I had read. After reading many books, i realise they confirmed each other's system. Just like in Jap candlesticks, we have shooting star on high volume to signify reversal at the top. Both Livermore and O'Neil cautioned in words that if the volume is heavy and price close near the day's low. They are talking about the same thing. : )

"It is what you do after 5pm that determines your riches" - O'Neil
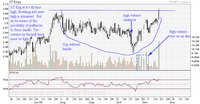

ST-Eng - Near all time high. knocking on heaven's door?


ComfortDelgro - Oil price eases, Oversea market increase...time to reverse?
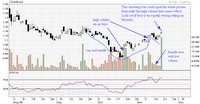


Chartered SemiCon- 3Q deliver lower loss than market expects, 4Q estimates back in black & new deal with Infineon.

Thursday, November 17, 2005

Trading is a mathematics game

I never truly understand money management until a year after I begin trading. To cut story short, if you set a target to take profit at $200 to $300 at sight and your cut loss is always $250, you are on a losing game. Unless you have a crystal ball and can predict at least 90% correct, otherwise you will lose $$$ in the long run. This was how i was trading when i first started. I tabulated my trading and found that i'm 45% correct during that period. However my cut loss (ill-discipline) was so bad that I end up losing $$$ overall. Only this year then did I realise Trading is a mathematical game after reading numerous books. If you are trading (Get it right! Trade or invest?), your target profit must be at least 100% of your cut loss. CANSLIM system uses 8% cut loss and 25% take profit. A very sound mathematical formula. Review your money management now if you smell trouble after reading! This is precisely why I'm never interested in 2 bids 3 bids kind of trade. Because I know my trading account is too small to capitalise in short trades. The broker fees will make it impossible for small account to trade intra-day on small gains. The anxiety and cold sweat is not worth it.

After reviewing the breakout plays on Sunday, I realise that a breakout in volume doesn't guarantee a breakout in price. The failure rate is pretty high. Chart formations plays a part. They reflect the normal buying, profit taking, buying sentiment of the counter. Historically if a stock is in a healthy incline, after a surge, it will form the bottom of a cup and handle as there are some profit taking by sellers but! there are also buyers who are looking to consolidate more shares. The it test the left side of the cup again, following that is another decline in stock but on very light volume. This is the kind of chart pattern accompanying a breakout in volume most profitable. Do you have the patience to wait for it to happen?

Other formations include double bottom and tight range breakout.

Also, I have been shouting breakouts upon volume confirmation. From now on, future breakouts in volume will be strictly screened and only valid breakouts with chart formations will be presented at 4:30pm daily.

As for market directions, strong economic data pushed index higher but the volume ain't convincing. However individual stocks like SPH has recorded higher than average volume. If more counters follow this trend, the bulls are back. Watch volume for indication. Also, Hewlett Packard is expected to deliver a strong set of FY05 results by market. If that happens, it could be the catalyst for a rally tomorrow in tech related stocks.
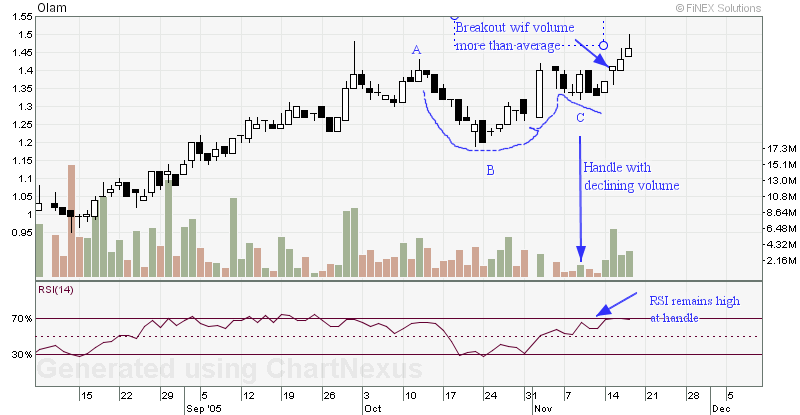

Olam - Check out it's similarities with DataCraft posted yesterday. I wouldn't advocate buying now. I'm just highlighting the importance of a handle for cup and handle breakouts.

Wednesday, November 16, 2005

Breakout amidst uncertain times

Spotted a breakout today with a classic cup and handle breakout. However, there should be a prior uptrend....this cup and handle will not fully qualify. But I decided to post because I like the volume. Jurong Tech and WantWant has the volume, but there were no chart formations hence i dropped them.

Yes, we are trading in range play. I am not buying at this time for fear of being caught offside and end up baby sitting. That's also the reason why I had not posted any articles. I spent the time deciphering the probable direction. STI has rebounded off close to 200ma and Sesdaq is flirting near it's 200ma. Very delicate and sensitive time. I only read the rebound today as mediocre...I wouldn't use it as a signal for reversal. If we close mixed by Friday, it is only good. Some form of selling is healthy if we want a sustainable uptrend. I read that the great bear market will descend when there are no more buyers left.


DataCraft

Sunday, November 13, 2005

Breakout Charts Review

I went through all the past 2 weeks of breakout shouts and found some very interesting points. If the breakout is valid, you will see profit almost immediately. So far there are a few outstanding ones and some that failed miserably. You can refer to the charts to get a better insight. I'm still figuring out my profit taking & loss cutting plan. No one will be able to take profit at the pinacle of the stock price. Hence I must work out a profit taking level to maximise win. Cut loss level is important as well. There are bound to be retracement or pull backs before another push up north. I do not wish to be shake out by this movement.

As for market directions, I remain bullish. There are no strong reversal signals yet. Current mode should be consolidations.

ChinaSun Weekly chart


Media Ring


ComfortDelgro: Not a breakout, but with oil price going down and the interest in SI.


Stats


Rotary


Hyflux


HL Asia


Global Voice


Chuanhup


BeautyChina