As for STI, we finally broke 2293 on a volume of more than average of 10 days. This augers will for it's strength. The most important thing I saw on the daily chart is we had register a higher low. Something that I had anticipated 3 weeks ago. Back then, STI had plunged more than 60 points in a day. The next few session saw an immediate technical rebound and many bought again only to see it gives up all the gains again. That is when I realise I must wait for the chart formation which symbolise the natural consolidation and distribution actions. Now that the higher low is formed, let us see a higher high set by breaking 2350. If it doesn't, I will be careful. Trading is all about risk/reward, i will just make sure my decision is well informed.
Some of you had emailed me about my breakout system. Here I wish to clarify, I did not invent this. This system is cheaply available on the book shelf titled "How to make money in Stocks by William J. O'Neil". I am just modelling he's success. : ) However you may want to know I did not base on just 1 book blindly. I have also understood Japanses candlesticks, MacD Histogram, Stochastics, RSI...etc...along with moving averages. You should click on my picture on the left panel to see what other books I had read. After reading many books, i realise they confirmed each other's system. Just like in Jap candlesticks, we have shooting star on high volume to signify reversal at the top. Both Livermore and O'Neil cautioned in words that if the volume is heavy and price close near the day's low. They are talking about the same thing. : )
"It is what you do after 5pm that determines your riches" - O'Neil

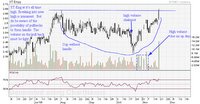
ST-Eng - Near all time high. knocking on heaven's door?

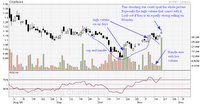
ComfortDelgro - Oil price eases, Oversea market increase...time to reverse?

Chartered SemiCon- 3Q deliver lower loss than market expects, 4Q estimates back in black & new deal with Infineon.