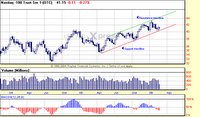
Agilent Tech: Triangle forming with higher lows and a resistance stands at 36.10. Weekly chart showing uptrend, daily trend ticks up following last night's gain. Target price $38.80, while cut loss to me is at $35.45.
As i'm learning to trade the US market, i will begin to post charts from US Market. Options Trading is fast becoming a hot instrument and i decided to find out more. First up, i shall explore the direction of the US market. If i can get into groove with US stocks direction then i will zoom into stocks and followed by options. Options are like warrants in Singapore market. A cheaper way to trade the expensive stocks.
Here are my analysis of the weekly charts of the US market.

Nasdaq seems to be poised for a move up north. It found nice support at lower trend line with lower shadow candlesticks and with MacD Histogram ready to reverse. I will be looking at Tech stocks tonight.

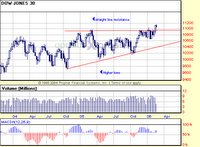
There seems to be an ascending triangle forming on the weekly chart of Dow. Today will be the last trading day of the week. If it's a breakout from the triangle top, there should be more upside next week. The lower lows on the weekly chart is something that caught my eye. Current uptrend is intact despite a rocky week.
Since both index look positive, i'll be looking at call options later. Keep tuned! Discipline is key to success, if i'm wrong, i will cut loss cold bloodedly.
DISCLAIMER: This is not an inducement to buy or sell. You should do your own analysis on top of my postings. Copyright © 2006 GrowMoney Blog. All rights reserved.